Back to Blogs
Which AI Has the Lowest Hallucination Rate? Why Benchmarks Don’t Tell the Full Story
If you searched for the AI with the lowest hallucination rate, here is the short answer: on public summarization benchmarks, the top frontier models post hallucination rates below 2 percent.
And here is the longer, more useful answer: that number will not predict how often your AI is wrong in production, because the lowest hallucination rate on a benchmark measures a narrow task under controlled conditions, while your enterprise workflows run broad retrieval, multi-step agents, and domain-specific queries where hallucination rates routinely run 10 to 40 times higher.
This article is written for the people who have to answer for AI accuracy inside an organization: CIOs and CDOs evaluating platforms, risk and compliance leaders preparing for audits, and finance executives trying to figure out why AI spend keeps growing while measurable returns do not. By the end, you will understand what an AI hallucination benchmark actually measures, why the AI model with the lowest hallucination rate on a leaderboard can still fail in your workflows, and what to measure instead if you need outputs you can defend to a regulator, an auditor, or a board.
Key insights
- The AI with the lowest hallucination rate depends entirely on the benchmark: under 2% on grounded summarization leaderboards, but 16–33%+ on open-domain factual tests for the same model generation.
- OpenAI’s o3 hallucinated on 33% of PersonQA prompts versus 16% for its predecessor o1, per OpenAI’s April 2025 system card, so newer reasoning models can hallucinate more, not less.
- Benchmark scores do not predict production accuracy, because enterprise workflows add messy retrieval, multi-step agents, and specialized domains where rates run far higher.
- Stanford RegLab found general-purpose models hallucinating on 69–88% of legal queries, illustrating how rates climb in high-stakes domains.
- The better procurement question is “what fraction of our outputs can we defend?” not “which model hallucinates least?”
- Defensibility is an architecture property, scored across five tiers from output-only to full training-data attribution, not a model leaderboard rank.
The core argument is simple. Picking a model by its benchmark hallucination rate is like hiring a driver based on their performance on an empty test track. The number is real. It just is not the road you drive on.
What an AI hallucination benchmark actually measures
An AI hallucination benchmark is a standardized test that measures how often a model generates content unsupported by its source material or by verifiable fact. Different benchmarks test very different things, which is the first reason the question “which AI has the lowest hallucination rate” has no single answer.
The most cited leaderboards fall into three categories:
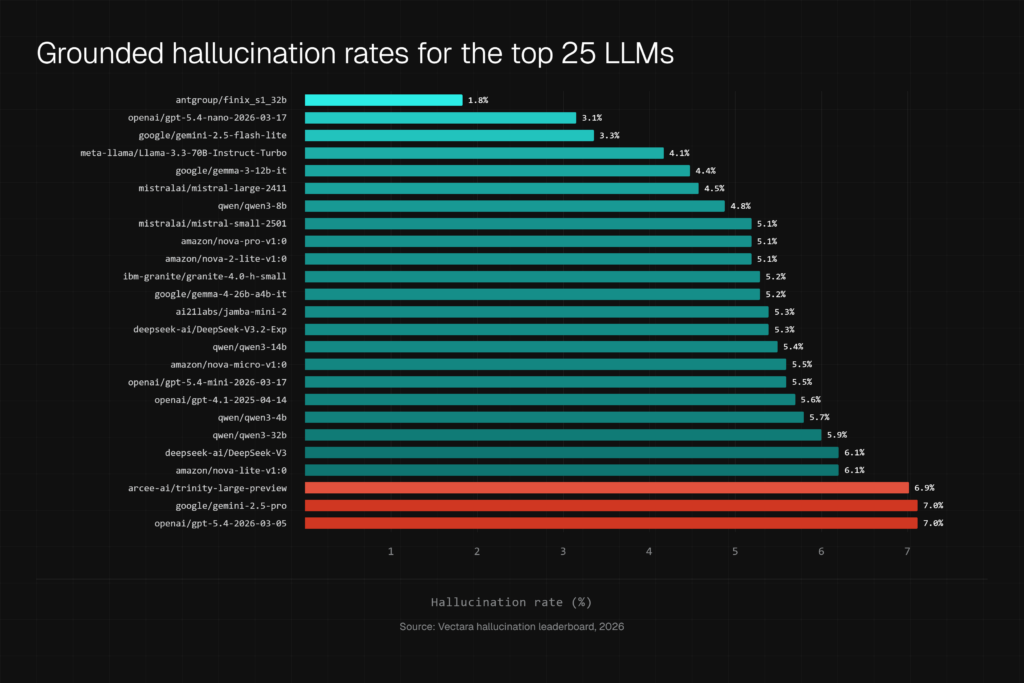
- Grounded summarization benchmarks. Vectara’s Hughes Hallucination Evaluation Model (HHEM) leaderboard gives a model a document and asks it to summarize. A hallucination is any claim in the summary that the document does not support. Top models score under 2 percent here. The task is deliberately narrow: the correct answer sits inside the provided text.
- Open-domain factuality benchmarks. Tests like OpenAI’s SimpleQA and PersonQA ask factual questions without providing a source document. The model must rely on what it learned in training. Hallucination rates explode on these tests. In OpenAI’s own system card published in April 2025, the o3 reasoning model hallucinated on 33 percent of PersonQA prompts, double the 16 percent rate of its predecessor o1, and o4-mini was higher still.
- Domain-specific evaluations. Academic groups test models on specialized tasks. Stanford’s RegLab found general-purpose language models hallucinated on 69 to 88 percent of legal queries in research published across 2024 and 2025. Even purpose-built legal research tools, evaluated in Stanford’s follow-up work, still produced incorrect or incomplete answers at meaningful rates.
Notice the spread. The same generation of models scores under 2 percent on one AI hallucination benchmark and over 60 percent on another. Neither number is wrong. They measure different tasks, and your enterprise workflows look far more like the second and third categories than the first.
The lowest hallucination rate on a leaderboard vs. reality in production
Benchmark rankings reward a specific skill: staying faithful to a short, clean, provided document. Production enterprise AI rarely works that way. Three structural differences explain why the lowest hallucination AI models on a leaderboard still produce confidently wrong answers in your workflows.
Retrieval gets messy. In production, the “source document” is whatever your retrieval pipeline pulls from million-document repositories, ticketing systems, contracts, and policy archives. If retrieval surfaces the wrong document, an outdated version, or a partially relevant passage, the model can be perfectly faithful to bad source material and still give your analyst a wrong answer. Benchmark conditions never test this.
Agentic workflows compound error. A single chat completion has one chance to hallucinate. An AI agent executing a multi-step task has a chance at every step: interpreting the request, choosing tools, reading intermediate results, and composing the final output. Microsoft Research has measured agentic tasks consuming roughly 1,000 times more tokens than simple chat interactions. More steps and more tokens mean more surfaces where a small per-step error rate compounds into a high task-level failure rate. A model with a 2 percent benchmark hallucination rate, run through a 20-step agent workflow, does not deliver 2 percent task error.
High-stakes domains are exactly where rates are worst. The Stanford RegLab legal numbers illustrate a general pattern: hallucination rates climb in specialized domains with dense terminology, frequent regulatory updates, and long-tail facts. Those are precisely the domains where enterprises in financial services, telecommunications, defense, and supply chain want to deploy AI, and precisely where a wrong answer costs the most.
There is also a trend working against the comfortable industry narrative. The newest reasoning models, optimized to think longer and act more autonomously, have posted higher hallucination rates on open-domain tests than their predecessors. The leaderboards that show hallucinations shrinking and the system cards that show them growing are both accurate. They are looking at different parts of the problem.
Comparing hallucination rates: A reference table
| Evaluation context | Typical hallucination rate | What it tells you |
| Grounded summarization (e.g., Vectara HHEM) | Under 2% for top models | Faithfulness to a clean, provided document |
| Open-domain factual QA (e.g., PersonQA, per OpenAI system card, April 2025) | 16% (o1) to 33% (o3) and higher | Reliability of training-data recall without sources |
| Legal queries, general-purpose models (Stanford RegLab, 2024–2025) | 69–88% | Accuracy in a specialized, high-stakes domain |
| Multi-step agentic workflows | No standard benchmark exists | Compounded risk across steps; largely unmeasured |
The last row deserves attention. The deployment pattern enterprises are scaling fastest, autonomous and semi-autonomous agents, is the one with no mature public AI hallucination benchmark at all. Anyone telling you their agent stack has “the lowest hallucination rate” is quoting a number from a different test.
Why “Which model hallucinates least?” is the wrong procurement question
Model selection matters, but it is the smallest lever available to an enterprise. Here is the uncomfortable math: switching from a model with a 4 percent benchmark rate to one with a 2 percent benchmark rate changes nothing about messy retrieval, compounding agent steps, stale source data, or your inability to prove where an answer came from. You have optimized the test track and left the road untouched.
A better question: what fraction of our AI outputs could we defend if challenged? Defensible means you can show what sources the system reasoned from, how much each source influenced the answer, and that a human can trace and contest the output. This reframing matters for three audiences at once:
- Regulators and auditors. The EU AI Act’s transparency provisions take effect in August 2026, with penalties up to 35 million euros or 7 percent of global turnover for high-risk systems that cannot demonstrate traceability. The NIST AI Risk Management Framework and OCC model risk guidance (SR 11-7) point the same direction. None of them ask for your benchmark score. All of them ask whether outputs are explainable and contestable.
- Finance leaders. Every hallucinated output still bills full token rates. McKinsey’s State of AI research from November 2025 found that while roughly 88 percent of enterprises use AI, only about 5.5 percent report significant ROI. Paying for confidently wrong answers, then paying again for humans to catch them, is a measurable cost. Some teams now track this as cost per defensible output (CPDO): total AI spend divided by the number of outputs that survive verification.
- Operators. When an output is wrong, a team with source-level visibility can find the bad document, score it down, and fix the pipeline. A team relying on benchmark rankings can only switch models and hope.
What to evaluate instead: A buyer’s checklist
When accuracy in production is the goal, evaluate the system architecture around the model, not the model’s leaderboard position alone. Use this checklist in vendor conversations:
- Can the platform show, for every output, exactly which source documents the model reasoned from?
- Does it score how much each source influenced the answer, so reviewers can rank and inspect the highest-impact sources first?
- Can your team remove, correct, or down-weight a bad source and see the effect on outputs?
- Are full execution traces logged for agent workflows, including every tool call and intermediate step?
- Can a non-technical reviewer (compliance officer, auditor, program manager) trace and contest an output without opening a notebook?
- Does the platform run in your required environments, including on-premises and air-gapped deployments for sovereignty-constrained workloads?
- Can you measure hallucination and defensibility rates on your own data and tasks, not just on public benchmarks?
This is the approach behind source-controlled AI, the architecture Seekr builds with SeekrFlow. Instead of treating the model as a black box ranked by an external AI hallucination benchmark, SeekrFlow traces every output back to the training data and source documents that shaped it, applies influence scoring so reviewers see which data carried the most weight, and keeps complete audit trails across agent executions. SeekrGuard adds model evaluation and certification before deployment. The result is not a claim of zero hallucinations. It is the ability to see, measure, and reduce them in the workflows where they actually occur, and to defend the outputs that remain.
How to compare AI platforms on defensibility, not just hallucination rate
If the right question is “which AI system produces defensible outputs,” then the comparison needs a scorecard that benchmark leaderboards do not provide. Score each platform you evaluate against five capability tiers. The difference between a tier-1 and a tier-5 platform predicts production accuracy far better than the gap between two models’ benchmark hallucination rates.
| Capability tier | What it looks like | Why it matters for hallucination |
| Tier 1: Output only | The system returns an answer with no source information | No way to verify; every output must be re-researched by hand |
| Tier 2: Citations | The answer lists which retrieved documents it used | Better, but you still cannot tell which source drove which claim |
| Tier 3: Per-output traceability | Each claim links to the specific passage that supports it | Reviewers verify in minutes; faithfulness failures become visible |
| Tier 4: Influence scoring | Sources are ranked by how much they shaped the output | Teams find and fix the bad source causing repeat errors |
| Tier 5: Training-data attribution | Outputs trace back to the training data and QA pairs that shaped model behavior | The deepest audit answer; satisfies regulators asking how a decision was made |
Most enterprise tools sit at tier 1 or tier 2. Retrieval-augmented systems reach tier 2 or tier 3. Platforms built specifically for governance reach tiers 4 and 5. When a buyer asks a vendor “which AI has the lowest hallucination rate on your stack,” the more revealing follow-up is “show me, for a single output, which sources drove it and how much each one contributed.” A tier-2 vendor cannot answer that. The answer, not the leaderboard rank, is what an auditor or a CFO actually needs.
One practical note on running this comparison: do it on your own data. Ask each vendor to run five of your real, messy, domain-specific queries through their system and show the traceability for each result. A platform that scores well on public benchmarks but cannot trace an answer on your contract repository or your claims data is solving the test-track problem, not the road problem.
Where benchmarks still help, and where this approach has limits
Benchmarks are not useless. They are good first-pass filters for screening models, useful for tracking generational progress, and reasonable proxies when your task closely resembles the benchmark task, such as straightforward summarization of provided documents. If your use case is low-stakes internal drafting with human review on every output, the AI model with the lowest hallucination rate on a relevant benchmark is a fine starting point and a full source-control architecture may be more than you need.
Honest limits run the other direction too. Source-controlled architectures reduce hallucinations and make the remainder traceable, but no system eliminates them. Verification still requires human judgment for the highest-stakes decisions. And measuring your own hallucination rate requires building an internal evaluation set from real workflow queries, which takes effort most teams underestimate. The difference is that with source-level traceability, that effort produces a feedback loop you can act on. Without it, you are reading leaderboards and guessing.
Summary: The lowest hallucination rate, in context.
Public benchmarks crown a different “lowest hallucination rate” winner depending on the task, and none of those tasks resemble production enterprise workflows with messy retrieval and multi-step agents. Model choice is a minor lever. Architecture that traces every output to its sources, scores influence, and supports contest and correction is the major one. Procurement teams get further asking “what fraction of outputs can we defend?” than “which model hallucinates least?”
Measure what benchmarks miss
A leaderboard rank does not tell you what fraction of your AI spend produces output you can stand behind. The CPDO calculator does, using your own numbers, in under three minutes.
Calculate your CPDO

Frequently asked questions
Which AI model has the lowest hallucination rate?
The AI model with the lowest hallucination rate depends entirely on the benchmark. On grounded summarization leaderboards like Vectara’s HHEM, top frontier models score under 2 percent. On open-domain tests like PersonQA, the same generation of models ranges from 16 to over 30 percent, per OpenAI’s own system card. There is no single lowest hallucination rate across tasks.
Why do reasoning models like o3 hallucinate more than older models?
Reasoning models like o3 hallucinate more on open-domain factual tests because longer reasoning chains generate more claims, and each unsupported claim is a hallucination opportunity. OpenAI’s April 2025 system card recorded o3 hallucinating on 33 percent of PersonQA prompts versus 16 percent for o1, even though o3 is more capable on many other tasks.
Are AI hallucination benchmarks reliable for enterprise model selection?
AI hallucination benchmarks are reliable for what they measure, which is narrow performance on standardized tasks. They are unreliable predictors of production accuracy because enterprise workflows involve retrieval over large messy corpora, multi-step agents, and specialized domains where rates run far higher than benchmark scores suggest.
What is the hallucination rate of generative AI in agentic workflows?
The hallucination rate of generative AI in agentic workflows has no standard public benchmark, which is itself the problem. Errors compound across steps, and a 2026 study analyzing eight frontier models on SWE-bench Verified found that agentic coding tasks consume roughly 1,000 times more tokens than single-turn code reasoning or chat, because the full context is re-read at every step.
What is cost per defensible output (CPDO)?
Cost per defensible output is total AI spend divided by the number of outputs that can be verified and defended with source-level evidence. CPDO turns hallucination from an abstract quality issue into a unit-economics metric a CFO can track, because every hallucinated output still bills full token rates plus the human cost of catching it.
How does source-controlled AI reduce hallucination rates?
Source-controlled AI reduces hallucination rates by making the model’s source material visible, scored, and adjustable. Teams can trace any output to the documents and training data that shaped it, down-weight or remove low-quality sources, and verify outputs against evidence, which both lowers the rate of hallucinations and makes the remaining outputs defensible under audit.
Can any enterprise AI system guarantee zero hallucinations?
No enterprise AI system can guarantee zero hallucinations. Generative models are probabilistic by design. The realistic enterprise goal is a low, measured, and falling hallucination rate on your own workflows, plus the traceability to catch and correct the errors that remain.
How should I compare AI platforms if not by hallucination rate?
Compare AI platforms on defensibility tiers rather than benchmark hallucination rate: whether the system returns sources at all, links each claim to a specific passage, scores how much each source influenced the output, and traces outputs to training data. Run the comparison on five of your own real queries, not on the vendor’s benchmark demo, because production accuracy depends on how the system handles your data, not the test set.
Sources
- Vectara, Hughes Hallucination Evaluation Model (HHEM) leaderboard (original ~1,000-document summarization benchmark, where top models scored under 2%)
- Vectara, “Introducing the Next Generation of Vectara’s Hallucination Leaderboard” (November 2025 refresh, 7,700+ articles, higher rates under tougher conditions)
- OpenAI, o3 and o4-mini System Card (April 16, 2025), PersonQA hallucination rates (o3 33%, o1 16%)
- Dahl, Magesh, Suzgun, and Ho, “Large Legal Fictions: Profiling Legal Hallucinations in Large Language Models,” Stanford RegLab and HAI (2024), hallucination rates of 69% (ChatGPT 3.5) to 88% (Llama 2) on specific legal queries
- Stanford RegLab and HAI, “Hallucinating Law: Legal Mistakes with Large Language Models are Pervasive” (overview)
- Bai, Huang, Wang, Sun, Mihalcea, Brynjolfsson, Pentland, and Pei, “How Do AI Agents Spend Your Money? Analyzing and Predicting Token Consumption in Agentic Coding Tasks” (arXiv, April 2026), on agentic tasks consuming roughly 1,000x the tokens of single-turn code reasoning or chat, measured across eight frontier models on SWE-bench Verified
- McKinsey, “The State of AI” (November 2025), enterprise AI adoption and ROI figures
- European Union, EU AI Act, transparency obligations and penalty structure (high-risk provisions effective August 2026)
- NIST, AI Risk Management Framework (AI RMF 1.0)

Accelerate your path to AI impact
Book a consultation with an AI expert. We’re here to help you speed up your time to AI ROI.
Request a demo